Like Alex, I’ve recently embraced Textmate after joining the Wufoo crew. And while I’ve been happy with my new-found text editor, I sorely miss my debugger. With a good debugger I can take a quick look at all my in-scope variables while I’m code-reviewing another person’s work or easily reach into the call stack of a deeply nested chunk of code without writing additional lines of code (like an echo statement) that I’ll have to clean up later.
Ideally, we’d want to write unit tests (a topic I’ll have to save for a later date), but they can be a bit impractical during a code-review or while exercising an already-existing, highly procedural code base. Since there’s no substitute for the real thing, I went in search for a debugger to accompany my Textmate setup.
MacGDBp
After looking at the options out there, which were scarce, I eventually settled on MacGDBp, a recently released open-source project run by Ryan of BlueStaic.org, an eighteen-year-old objective-c wizard. The software compliments Textmate fairly well. It’s light-weight, fairly easy-to-configure and like all of the other solutions out there, built on top of Xdebug, a foundation that provides the requisite set of features developers using heavy-weight IDEs have come to expect.
The Interface
While most developers are used to the inner-workings of a debugger, there’s unfortunately not a lot of instructions provided with MacGDBp (since it’s just been released) and so I’ve decided to included a screenshot of the application stopped at a breakpoint in some code to highlight some of the basic features in its interface.
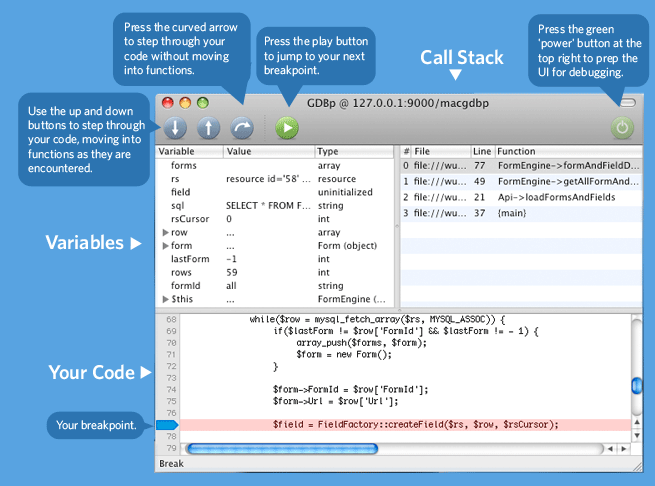
MacGDBp contains three panes : one for your call stack, another for the local and global variables available to your currently observed function, and a view of your code showing the line currently being executed. With this setup, I can quickly step through my code, set breakpoints and inspect my variables at any point in my application. To set up a breakpoint, just type Command-Shift-B while the app is in focus and it will bring up a window that looks like this:
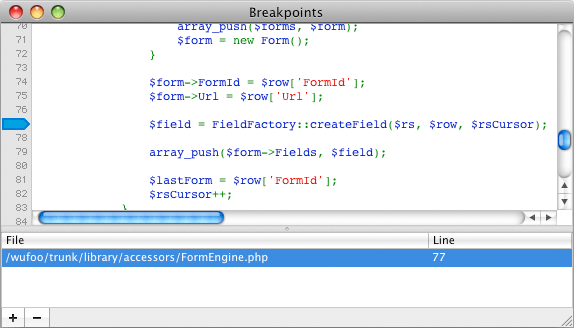
From here, just click on the plus sign to select a php script and then click on the left side of the line numbers to add a breakpoint in your code. The bottom pane will also let you see the scripts and the line numbers where you’ve created past breakpoints.
Notes on Setup
You’ll want to be sure to follow the setup instructions listed in the help section of the Blue Static site.
The most difficult part of setting up MacGDBp is setting up the Xdebug extension. You cannot use the built-in web server because that version of PHP will not properly execute Xdebug. Instead, the easiest method is to download MAMP. After installing Mamp, you have to install Xdebug.
The Xdebug setup isn’t too bad. Just copy the xdebug.so plugin file to the directory he specifies and then make the changes he recommends to your php.ini file. If you’re using Zend Optimizer, be sure to comment it out or disable it or it will prevent the debugger from functioning. Once you get everything setup, MacGDBp will then listen for any connection coming into your computer on port 9000. The Xdebug extension works by connecting to the specified host and port in php.ini and if MacGDBp is running on the specified host, then the two will connect.
I’m not promising a completely smooth ride, as the software is still fairly new and is still a bit buggy. For example, I’ve had the debugger in my dock since last week but just got a working copy of it installed on my machine a few days ago. Fortunately, my posts to the bugs section were quickly answered by the developer himself and he’s been putting out new builds quite regularly. Overall, I’m very satisfied to find a lightweight, unobtrusive debugger that I can use to silence my echo statements.


I sort of skim read this article whilst scanning every line for the “download snappy TextMate bundle” link that was going to make all this a reality for me. Are you hooking into MacGDCb via TextMate key binding or opening MacGDCb independently (just like you would run Xcode build/debug independently from TextMate)?
Hey Nic. I, too would like to see a TextMate bundle for this. Maybe TextMate 2.0 will provide the ease-of-use for add-on developers and we’ll see more great products created. For now, I’m running it independently.
Great post. With your instructions I got this running in under 10 minutes. I’ve tried to setup a key binding for this in TextMate but I first checked if MacGDCb was scriptable via Applescript. Which is not implemented—yet, I hope. But for now I just put in the function call to xdebug with
into my code. It will not trigger if there is no debugger connected. So you don’t have the well-known ‘Oops I forgot to take out the echo’-problem.
But I did find this. If you write this in you php.ini it will at least give you a link in TextMate’s protocol so it will take you directly to the line in your code where errors was found.